Summer Demand Management
If you participated in Change Energy’s Summer Demand Management Program and reduced your consumption when we issued peak alerts, your Capacity Charges beginning October 2020 could be dramatically lower. Capacity usually accounts for around 30% of total electricity cost.
Calculation of Capacity Cost
Change Energy provides Summer Demand Alerts to customers that have registered for our program. The aim of the program is to assist in reducing customer Capacity Costs for the coming year.
At the end of each summer, the Australian Energy Market Operator (AEMO) identifies the four days in December-March on which the grid experienced the highest demand. On each of these four days, the three 30-minute intervals showing highest demand for the day form the total 12 peak intervals that are used to calculate each customer’s Capacity Charges.
Summer Demand – Peak Days in Detail
Change Energy issued alerts on nine occasions and was successful in issuing alerts on all four of the peak days for the 2019-2020 season.
The result – Change Energy customers participating in the program will save a total of $580,000 over the 12 months beginning October 2020, with some customers reducing their Capacity Cost to nil.
If you would like to sign up to our Summer Demand Program for next season, please contact us via info@changeenergy.com.au (free to all Change Energy customers with no obligation to participate).
Peak Days:
The four peak days were all business days of normal trading with hot maximum day-time temperatures. Compared to last year’s less predictable mix of non-working days including public holidays and weekends, this year’s peak days were more in line with historical trends reflecting a strong correlation between maximum temperatures and peak demand.
Thursday 12/12/19 3590 MW
Monday 03/02/20 3620 MW
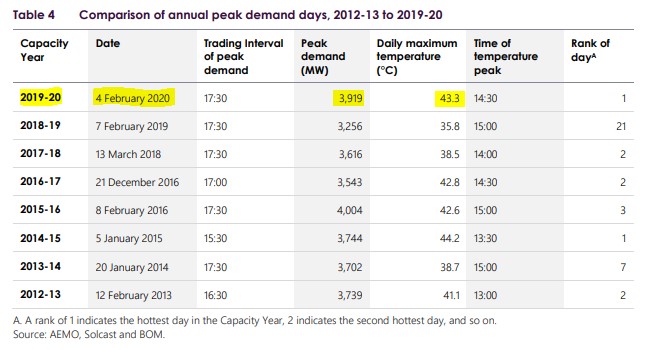
Tuesday 04/02/20 3919 MW
Friday 14/02/20 3580 MW
The peak demand of 3919 MW occurred on Tuesday 4th February between 5:30-6:00pm; it was preceded by two consecutive days over 35 degrees. This peak occurred on the hottest day of the year and was the second-highest peak (and third-highest daily peak) event since the market began in 2006. This is the highest peak demand since the 2015-2016 season. All 12 peak intervals occurred between 5pm and 7pm, reflecting the impact of the growing amount of rooftop solar. Solar reduces the demand on the grid during daylight hours, pushing the peak events later in the day as reflected in the table below.
Table 1


